
Tairāwhiti data, 27 October 2023
Tairāwhiti data, 27 October 2023
Covid review by age group
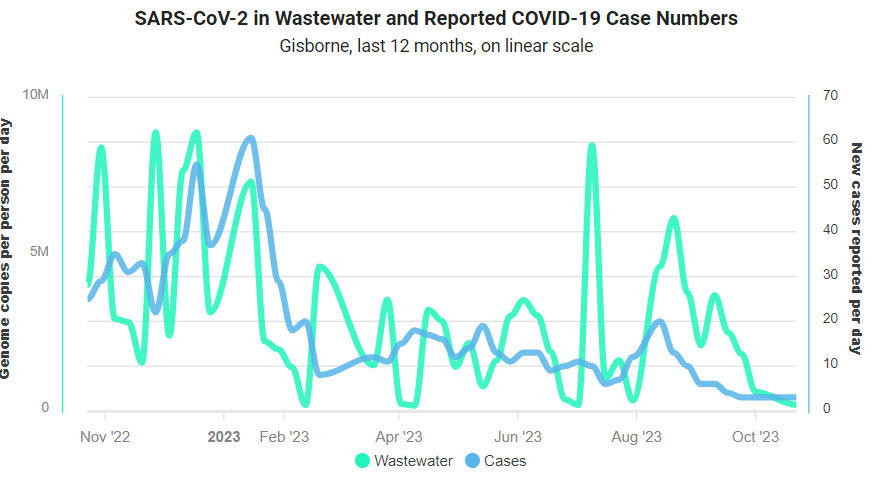
Covid-19 notifications in Tairāwhiti continue at low levels with 26 cases reported in week ending 26 October, compared to 21, 17, 26 and 14 for the previous four weeks. The pattern this week suggests a possible increase, as notifications increased during the week to peak at 8 cases on Thursday 26 October, compared to only five cases for Friday to Monday, inclusive.
Local wastewaster data showed a slight decline in wastewater levels for week ending 22 October:
One Covid hospitalisation this week for total of three for October so far, compared to four in September and ten in August.
This week marks the end of winter illness surveillance - last weekly update for 'Influenza and other viral respiratory surveillance’. The data will be updated only monthly until next winter. The levels of acute respiratory illness have continued to decline in October.
Other notifications
We only had one non-Covid notification: a case of Shiga Toxin-Producing Escherichia coli (STEC). On 1 September, I wrote on about this potentially life-threatening infection. And in more detail in: gastro in Tairawhiti.
We were also notified a case of tuberculosis (TB), but this was a case of latent TB infection (LTBI). WHO defines LTBI as “persistent immune response to stimulation by Mycobacterium tuberculosis antigens with no evidence of clinically manifest active TB. Up to one third of the world’s population is estimated to be infected with Mycobacterium tuberculosis, and on average, 5–10% of those who are infected will develop active TB disease over their lifetime.”
Covid review: 3. Age
My first reviews noted a different pattern for Covid-19 cases and hospitalisations; how does this change by age? To look at age, I created these arbitrary age groups: children (<15 years), young adults (15-24 years), adults (25-49 years), and three groups of older adults: 50-64 years, 65-79 years, and 80+ years.
Let’s first look at the number of cases by age group for each quarter from January 2022 to end September 2023:
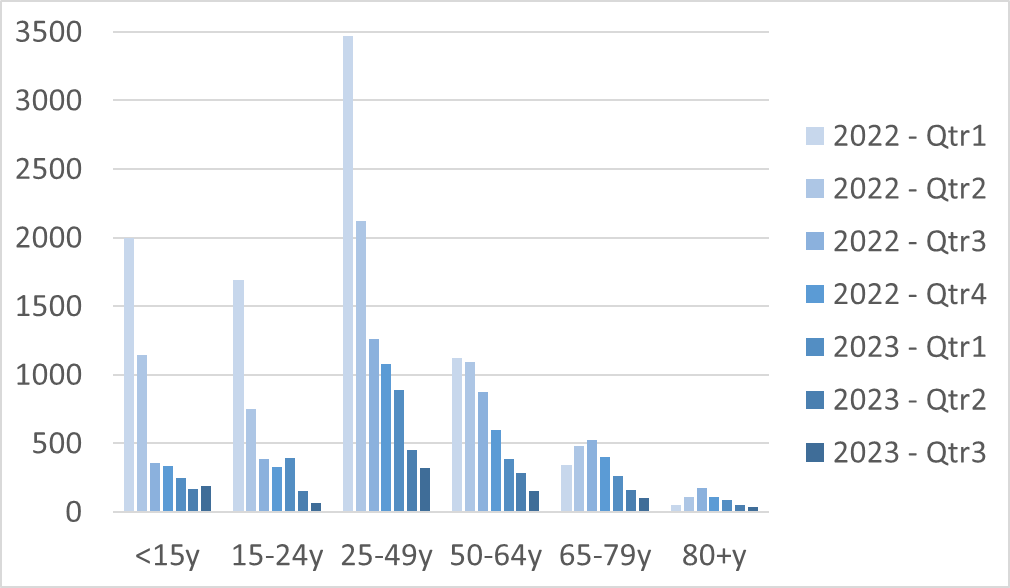
For the two oldest groups, the peak is not until Q3 of 2022, in contrast to the younger groups all having the most cases in Q1 of 2022. The youngest of the three older groups (50-64 years) has similar pattern to the younger ones, but a smaller4 peak in q1 of 2022. The later take-off in the older groups may be the result of more sheltering in the first half of 2022.
In contrast to the quarterly decline in cases, hospitalisations show less variability:

For children, there were as many hospitalisations in the last two quarters as the first two, and there seems little relation between cases and hospitalisations - possibly reflecting a high level of unreported cases after the first two quarters. For the oldest age groups, the peak in cases and hospitlaisations were both in Q3 of 2022; but for the other age groups there is no match.
Overall, the case-hospitalisation ratio was nearly 10 per 1000 (1%). The lowest ratios were 1.1, 2.6, and 5.4 per 1000 for those aged 15-24, 25-49, and <15 years, respectively. The ratio increased for the three older groups at 8, 21, and 167 per 1000 for those aged 50-64 years, 65-79 years, and 80+ years, respectively
By quarter, the case-hospitalisation ratio rose for each quarter in 2022: 0.32%, 0.67% , 1.23%, 1.57%, from first to fourth quarter. It dropped slightly in Q1 2023 1.33% before plateau of 2.46% and 2.43% for Q2 and Q3 2023, respectively. Chart of quarterly change in case-hospitalisation ratio, by age-group:
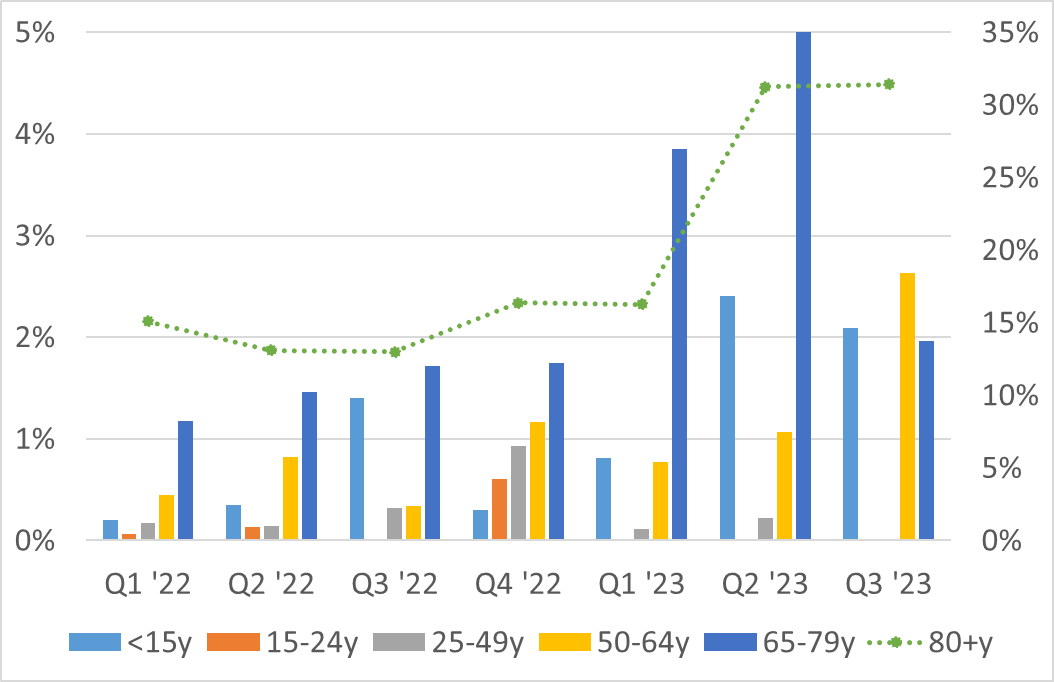
I put the case-hospitalisation ratio for 80+ years on the secondary axis, as it is so much higher than then others. The increase over time for all age groups probably reflects under-reporting of cases over time, as the virus was not getting more virulent.
Next week
As always, look forward to your feedback and suggestions; and any questions on the data. Thank-you!