
Tairāwhiti data, 20 October 2023
Tairāwhiti data, 20 October 2023
Covid hospitalisations review
Covid-19 notifications in Tairāwhiti continue at low levels with 21 cases reported in week ending 19 October, compared to 17, 26 and 14 for the three previous weeks. No new local wastewaster data; nationally both showed very small increase to flat for week ending 15 October
We had two Covid hospitalisations last week, after three weeks without any.
Other notifications
We had a case of invasive pneumococcal disease (IPD) in an under five-year old who was fully immunised. We await the serotype to see if this was a vaccine failure, or caused by a serotype not in the vaccine.
I shared local IPD data in 21 July post. With this new case and one reported in September, we have now had 11 IPD cases this year. More than any other full-year totals, except in 2021 when we had 15 cases.
No new cases in typhoid cluster. We don’t expect any more cases, but a very long incubation period is possible.
Covid-19 Hospitalisations
Tairāwhiti has one hospital covering the district. They have been keeping a record of admissions with Covid since the start of the Omicron wave. There have been 260 Covid hospitalisations since February 2020 to 30 September 2023, shown here by quarter:
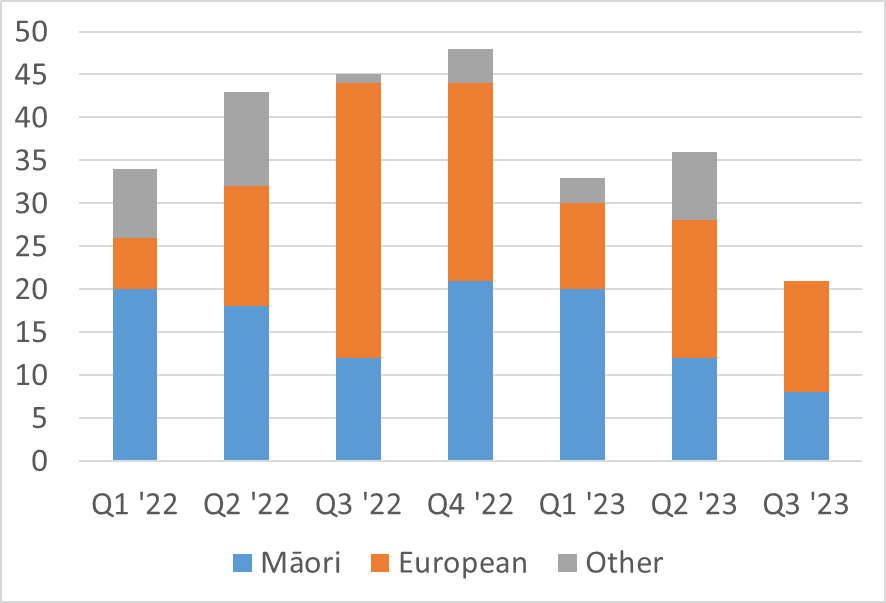
The slight increase in hospitalizations through 2022, contrasts to notified cases that decline each quarter (see last week). There is also less of a decline in hospitalisations for 2023 vs 2022 compared to cases.
Looking at the case-hospitalisation ratio overall, just over 10 per 1000 cases were hospitalised, but the ratio varied over time, from ~ 0.5%for the first months now over 2% (20 per 1000).
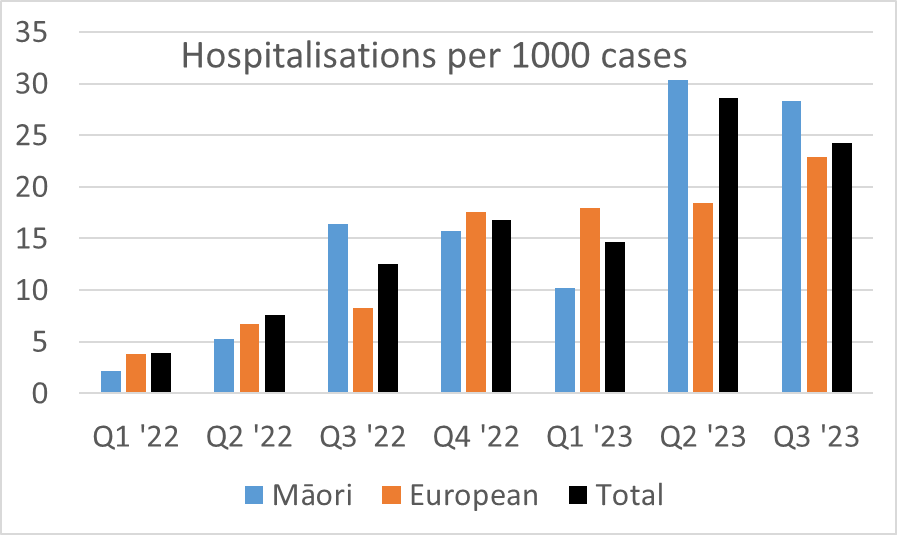
The relative increase in Māori hospitalisation ratio may reflect greater under-reporting of cases. One could expect a higher Māori hospitalisation because of risk factors, except for age as the Māori population is younger than European. Overall, Māori had slightly lower case-hospitalisation ratio at 8.8 per 1000 cases compared to 10.6 per 1000 for Europeans.
Only four of the 260 hospitalisations were in Pasifika to give a case-hospitalisation ratio of 5.9 per 1000 cases, or just over half the overall ratio of 10.3 per 1000 cases.
Readmissions
Twelve of the 260 were re-admissions, but no person was admitted more than twice. (In contrast to up to five infections reported). Nearly half (n=5) were re-admitted within a week of first admission, another two in the second week, and the remainder from a month to over a year later.
Reason for admission
The hospital record notes if the admission is for Covid or another reason (where Covid is coincidentally found) or both:
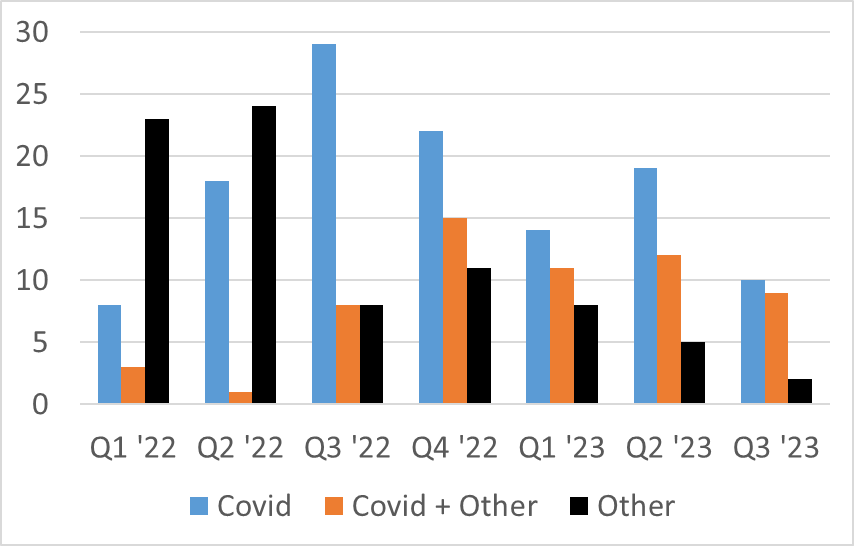
The increase in Covid alone being the reason for admission for the first 3 quarters is notable, and could be related to more spread to more vulnerable groups as the virus spread over the first few months, in line with the increase in case-hospitalisation ratio.
Age
Looking at the age distribution of hospitalised cases again shows the increase in the older age groups over the first three quarters of 2022:
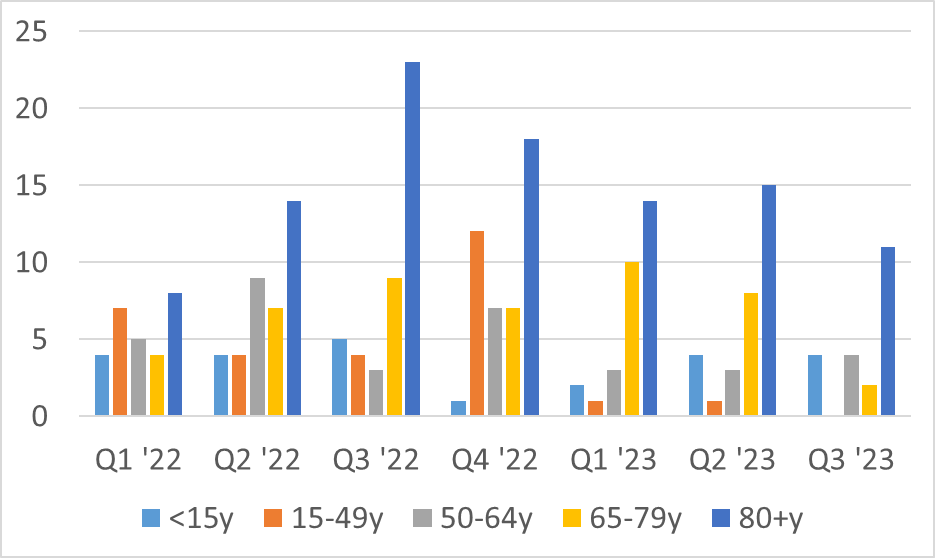
The number of children (aged <15y) hospitalised has remained low but relatively constant.
Reflection on data
The hospitalisation and case data show very different patterns, highlighting that different data sources show different pictures of a disease. The other aspect of these data is that I would have presented a very different picture if I had used EpiSurv to identify hospitalisations. For the same period EpiSurv, only had 164 cases whose record showed hospitalisation (compared to 260 reported by the hospital).
Next week
As always, look forward to your feedback and suggestions; and any questions on the data. Thank-you!