
Tairāwhiti data, 17 November 2023
Tairāwhiti data, 17 November 2023
Covid rise increases; local lives (not) lost during the pandemic
Covid-19 notifications in Tairāwhiti more than doubled for week ending 16 November with 117 cases compared with 49, 42, 26, 21, 17, 26 and 14 for the previous seven weeks.
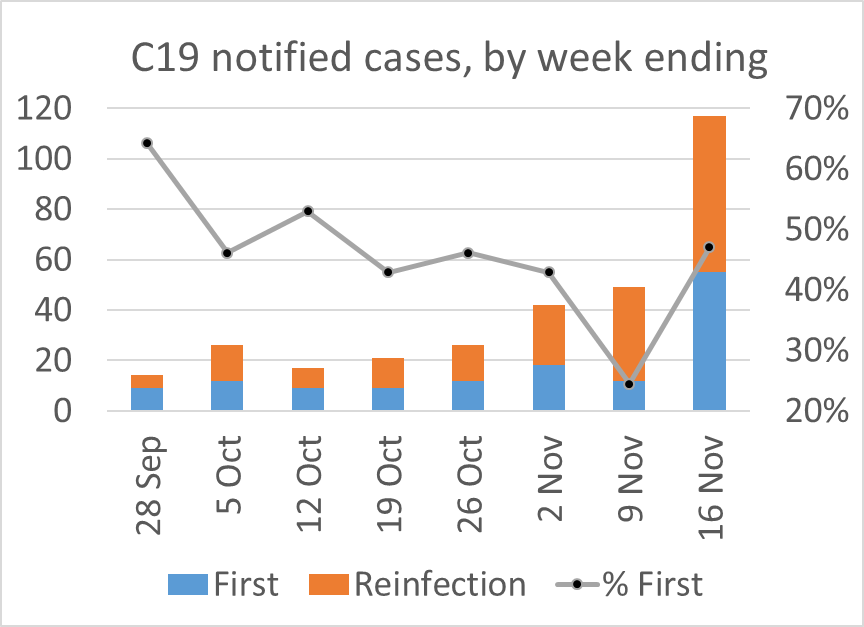
Note that nearly half the reported cases were first reports, in contrast to the declining proportion of first infections we had seen in previous weeks.
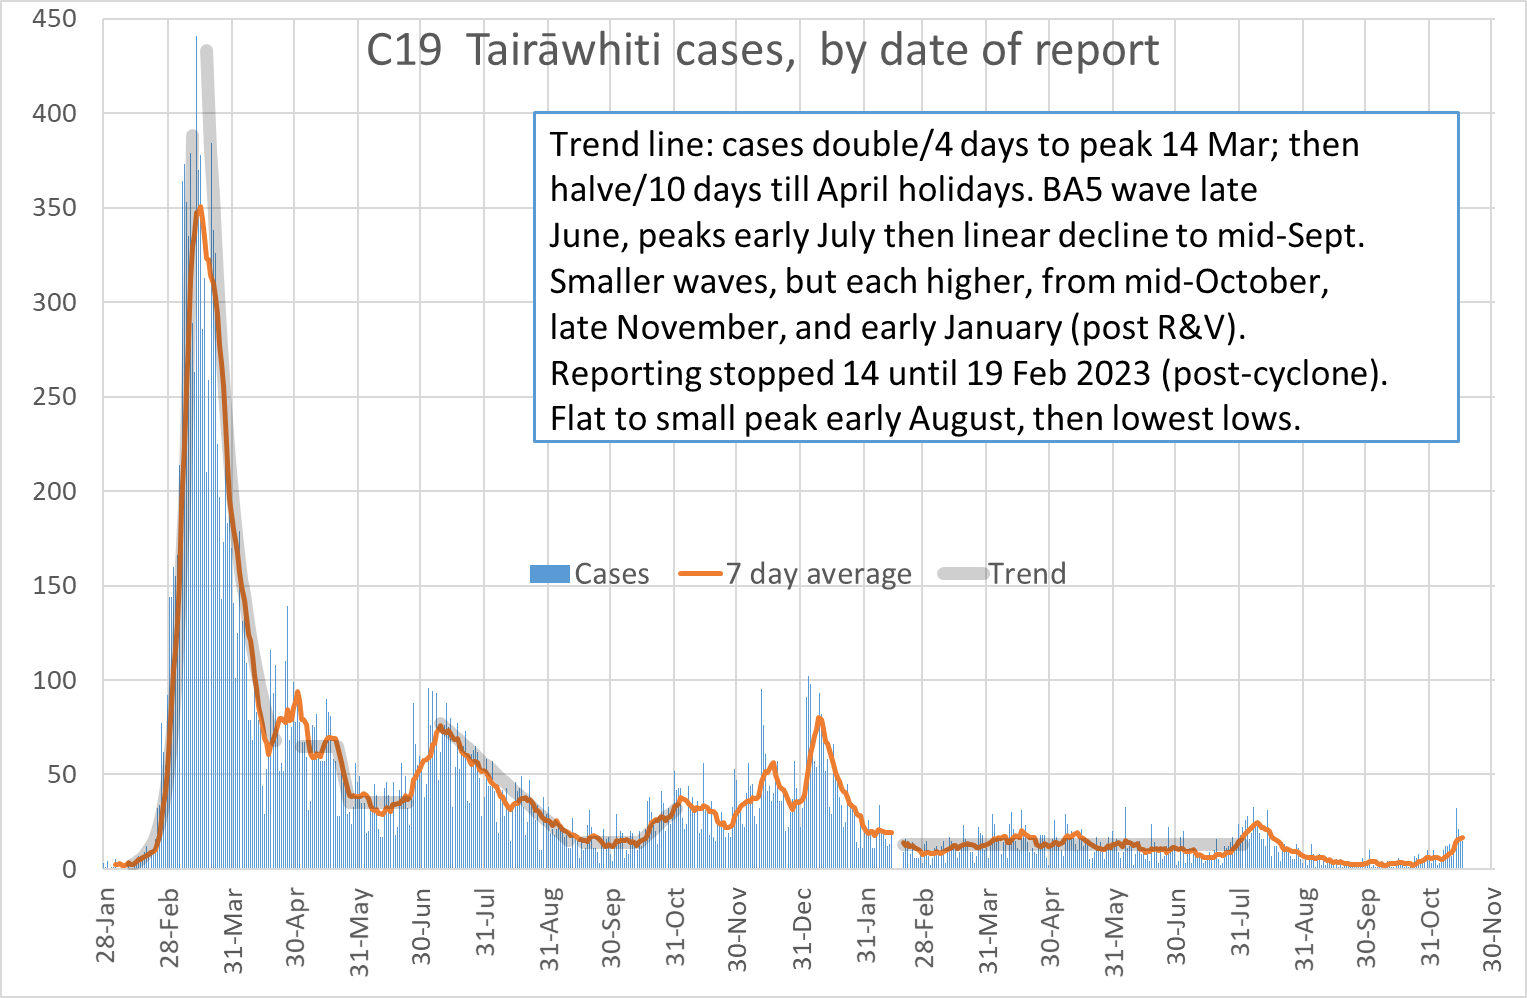
The 7-day average incidence was 17 cases per day compared to 7 cases per day last week. with most cases (32) reported on Monday. The daily chart shows a similar wave to August 2023:
Local wastewaster data for week ending 12 November shows a bigger rise in wastewater - much higher than the August 2023 peak.
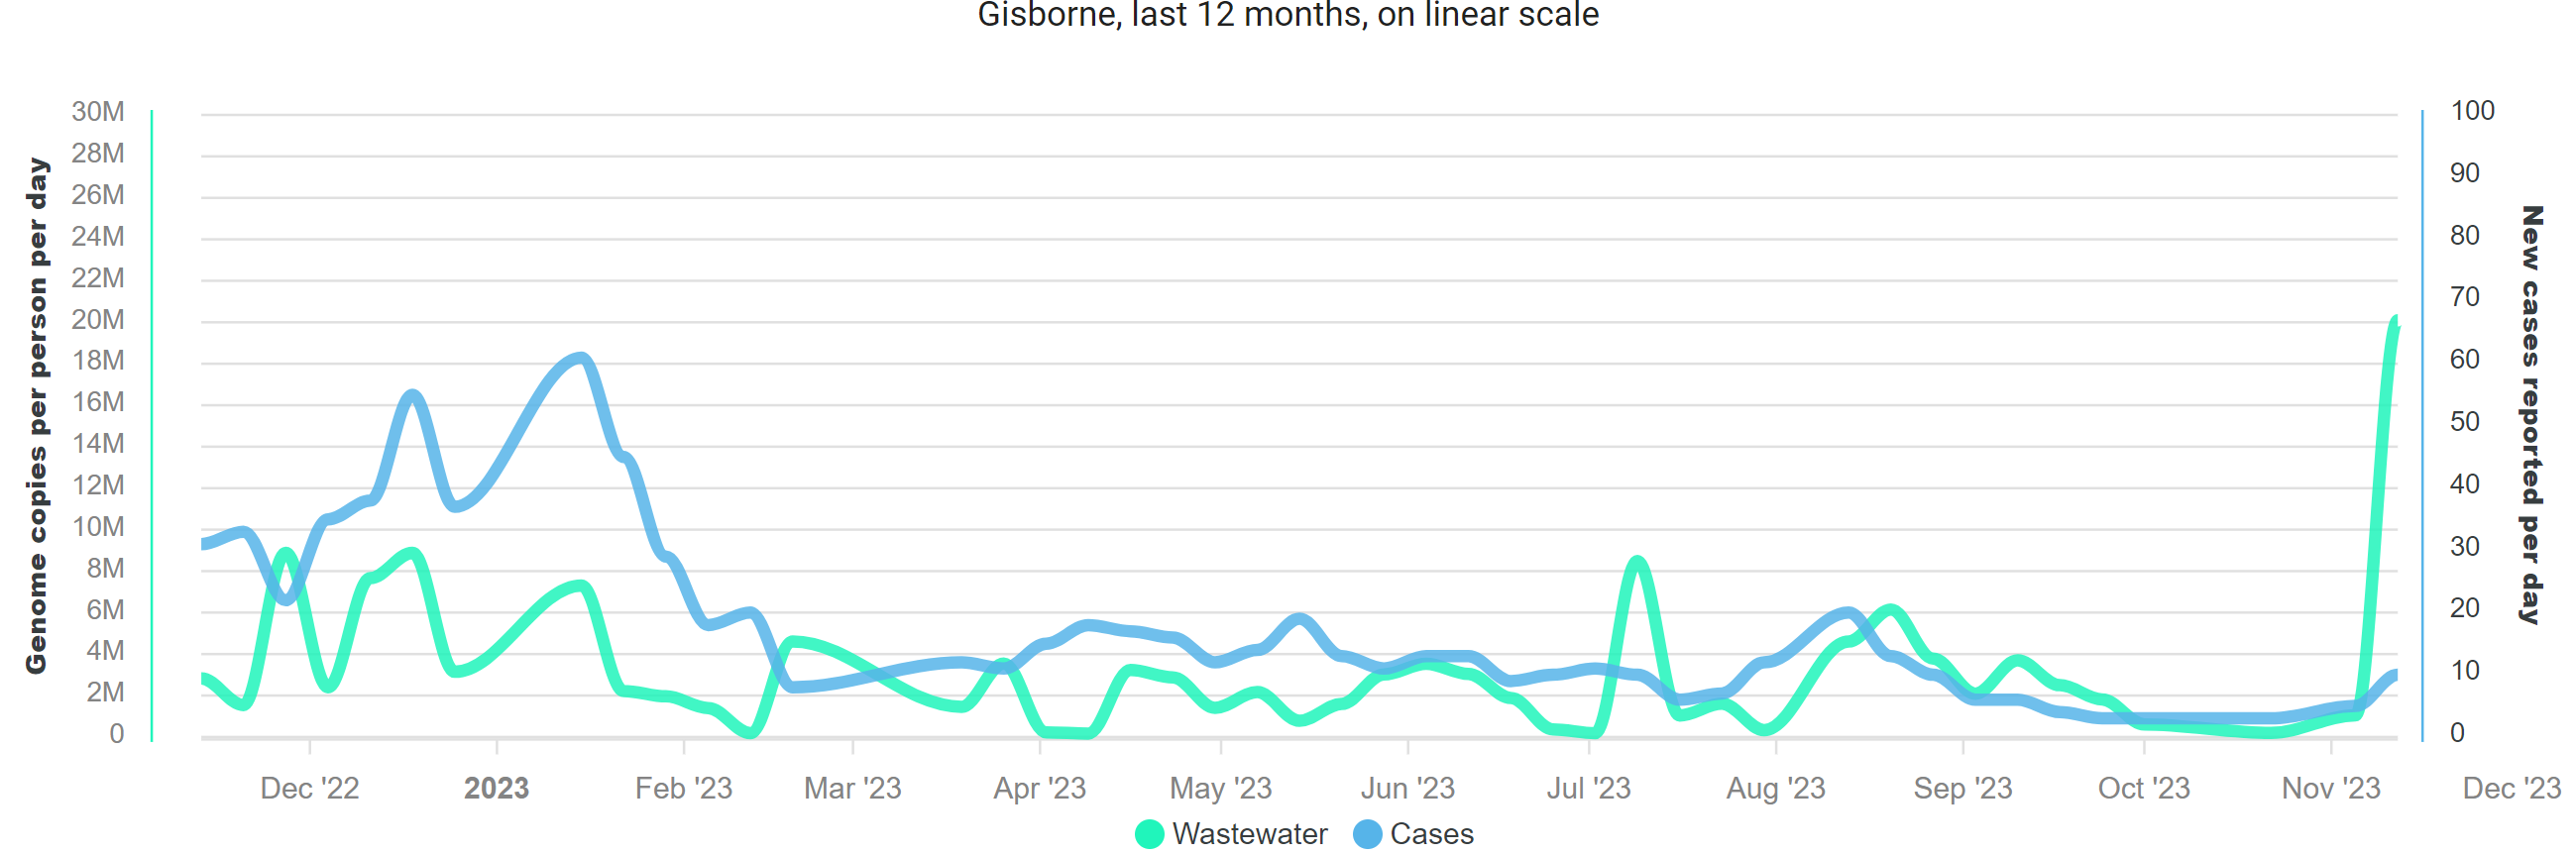
In contrast to the local rise, national wastewater was lower for the week ending 12 November than the previous week.
There were six Covid hospitalisations this week, after two weeks with none. This contrasts with 3, 4, and 10 hospitalisations for October, September and August, respectively.
So, we are at the start of another wave. Media commentary on this ‘fifth wave’ makes me look at my daily chart (above) where I can see more peaks. But there has not really been any waves that have been anything like the first one, when we first ‘met’ the virus. The virus continues to evolve to evade immunity, immunity wanes, mixing patterns change…please get a booster if you are at increased risk of severe disease, and it is 6 months or more since your last dose or last infection. Healthy habits and good hygiene are important for all infections; staying home when ill and wearing a mask to prevent spread to others.
Other notifications
Three enteric notification this week: one each of Campylobacter (see 25 August), Yersinia and STEC. On 1 September, I provided data on STEC notifications from 1997. At that time we had 12 cases. and this new case brings the total to 16 for the year compared with 11 and 20 cases for 2021 and 2022, respectively. In 2021, we changed to PCR diagnosis that increased the detection of this organism from 0 to 3 cases per year from 2011 to 2020. See more detail about the rise in STEC and Yersinia in my April 2023 report on gastro in Tairawhiti.
Local excess deaths in the pandemic
One way to measure the impact of an event is to count how many deaths it caused: excess deaths compared to the expected number. While we have reliable statistics on actual deaths, how do we calculate the expected deaths? The issue is that the number of deaths depends on population size, structure, and mortality rates. Statistics New Zealand has data on deaths from 1952:
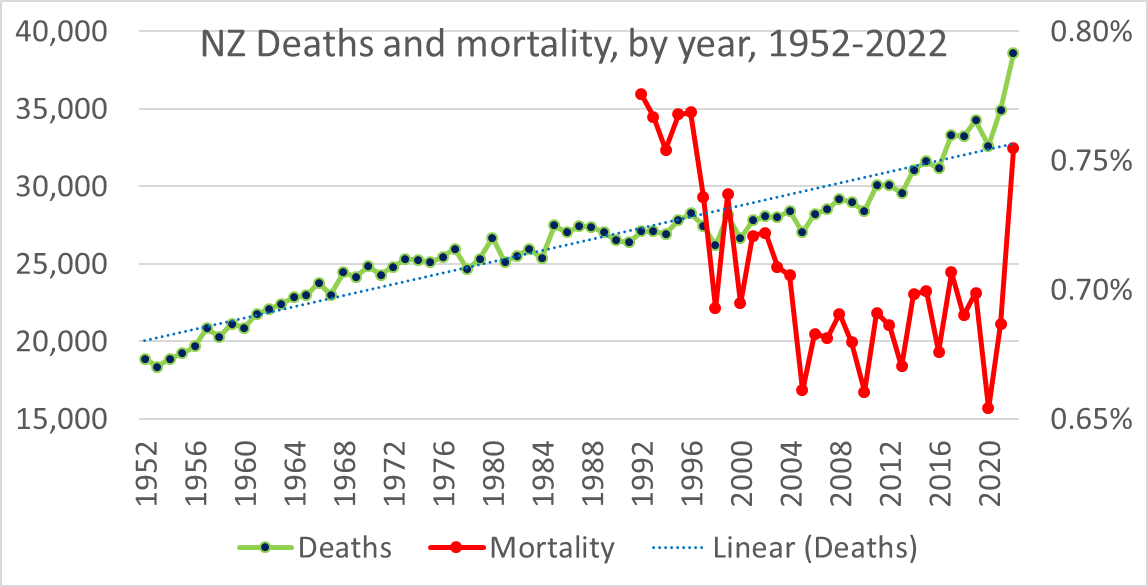
The number of deaths increases over time, largely reflecting the growth in population. I have calculated the mortality based on stats population at the end of the previous year (only from 1992) - this is the percent of those alive at the end of year who died in the following year. The lowest mortality was in 2020 (0.65%), with 2022 mortality (0.75%) in line with the higher mortality of the 1990s, and 2021 mortality (0.69%) similar to that of the 2000s.
One way to calculate expected deaths is to look at the average of previous years, but this ignores the trend for more deaths every year. And which years are included will change the average and hence the expected deaths. This is why different methods give different results.
Looking at Tairāwhiti deaths, I used financial instead of calendar year, to include the latest data (up to June 2023). Note that this makes the dip in mortality shift from the 2020 year to 2021, as the 2020 year end (30 June 2020) only captured a few months of avoided mortality.
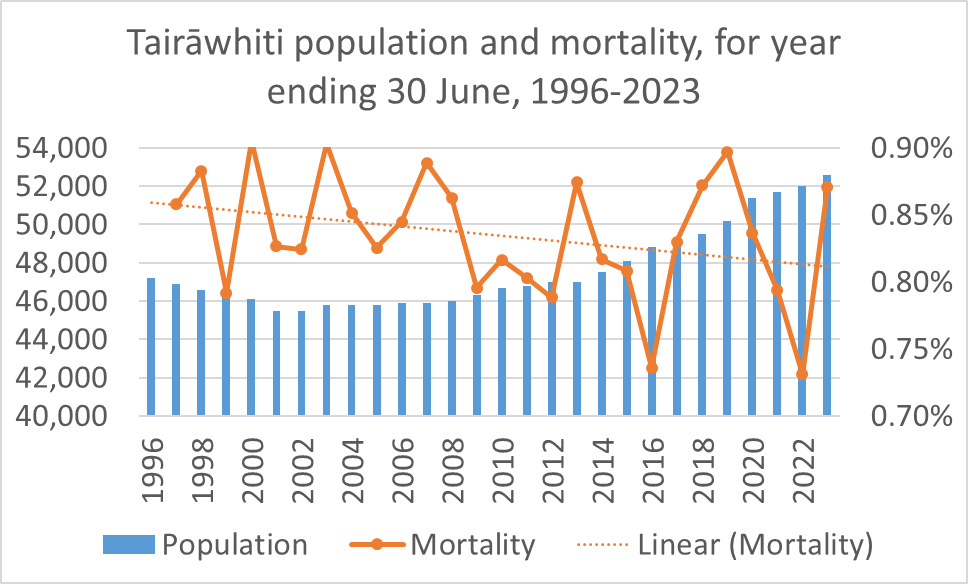
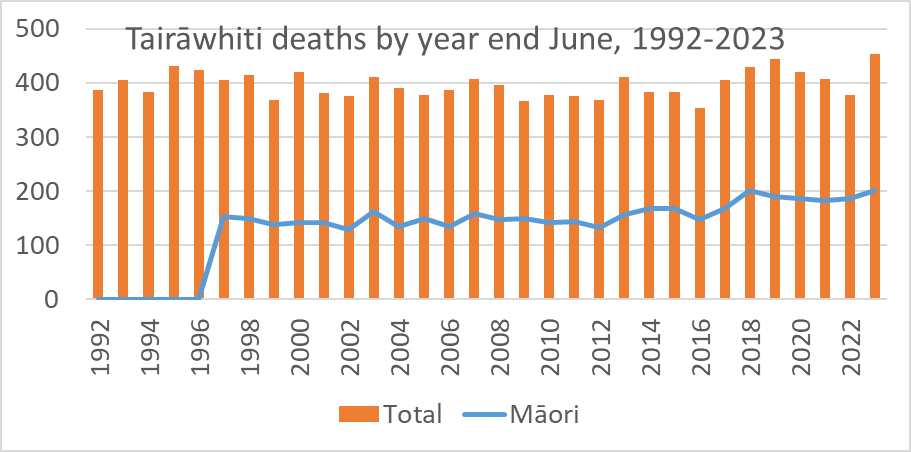
Note that mortality is higher in Tairāwhiti than the rest of country, presumably because of our deprivation and other aspects of our population. The number of deaths per year (ending June) in Tairāwhiti:
And here are the numbers for recent years that offer potential baseline:
As 2016 deaths are much lower, the average deaths for 2016-2019 (408) are lower than for 2017-2019 (428). The expected number of deaths changes the excess deaths, as we can see by comparing the use of these two averages: excess deaths for the years 2020 to 2023 would be 27 or -45, respectively.
Using the 2017-2019 average for expected deaths, we had -6, -18, -48, and 27 excess deaths for 2020 to 2023. The 45 cumulative negative excess deaths during the pandemic years mean that 45 people were alive in our district at end June 2023 who would not have been alive without a pandemic. This compares with the 385 nationally (or about 4 for our district) based on the Bloomberg analysis that I previously wrote about.
If instead of the average, we drew a trend line from 2016 to 2019 to predict future deaths, we would have -417 excess deaths:
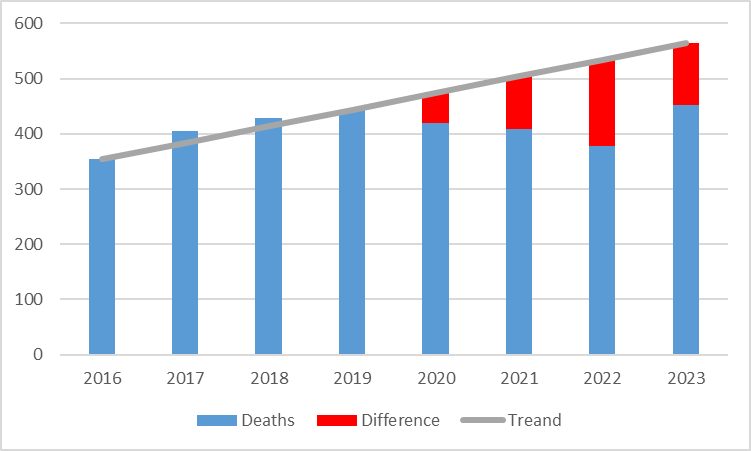
The deaths avoided were mostly due to prevention of other respiratory infections (especially influenza) from our pandemic response, and as these deaths are mostly in winter we can see the impact if we look at quarterly deaths:
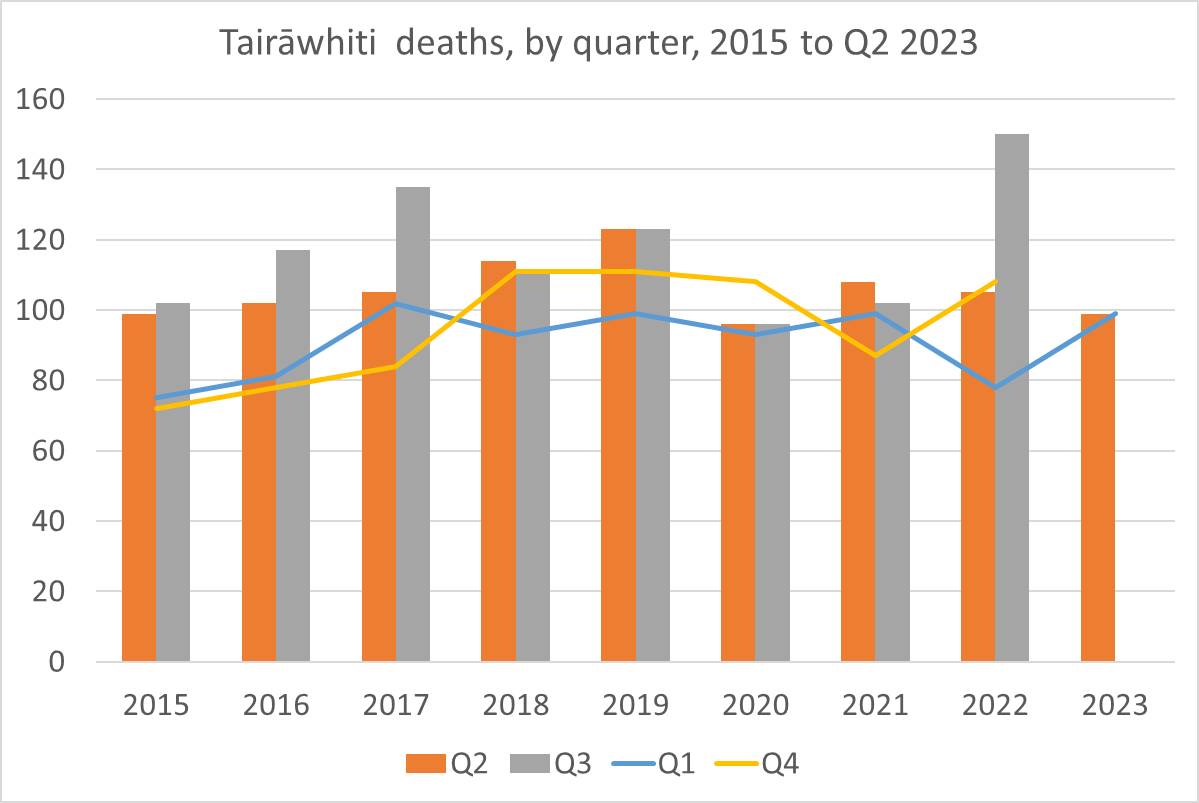
To help see the winter deaths (mostly in Q3, with some in Q2), I have charted the two mid-year quarters as bars. Of note, the increase in deaths in Q3 2022; and no increase in deaths in the mid-quarters (compared to Q1) in 2020.
Next week
Will Covid continue to rise? As always, look forward to your feedback and suggestions; and any questions on the data. Thank-you!